
One of the most essential skills in forex trading is knowing how to read a chart. Charts aren’t just colorful lines and shapes they tell the story of price movement, sentiment, and opportunities.
For new traders, it can feel overwhelming. But don’t worry in this guide, we’ll break down the basics of forex charts in a simple, beginner-friendly way, so you can start analyzing the market with confidence.
What Is a Forex Chart?
A forex chart is a graphical representation of the price movement of a currency pair over time. It helps traders understand past trends, current price action, and potential future movements.
Charts are the foundation of technical analysis, which is the study of price patterns and indicators to make trading decisions.
Types of Forex Charts

There are three main chart types used by traders:
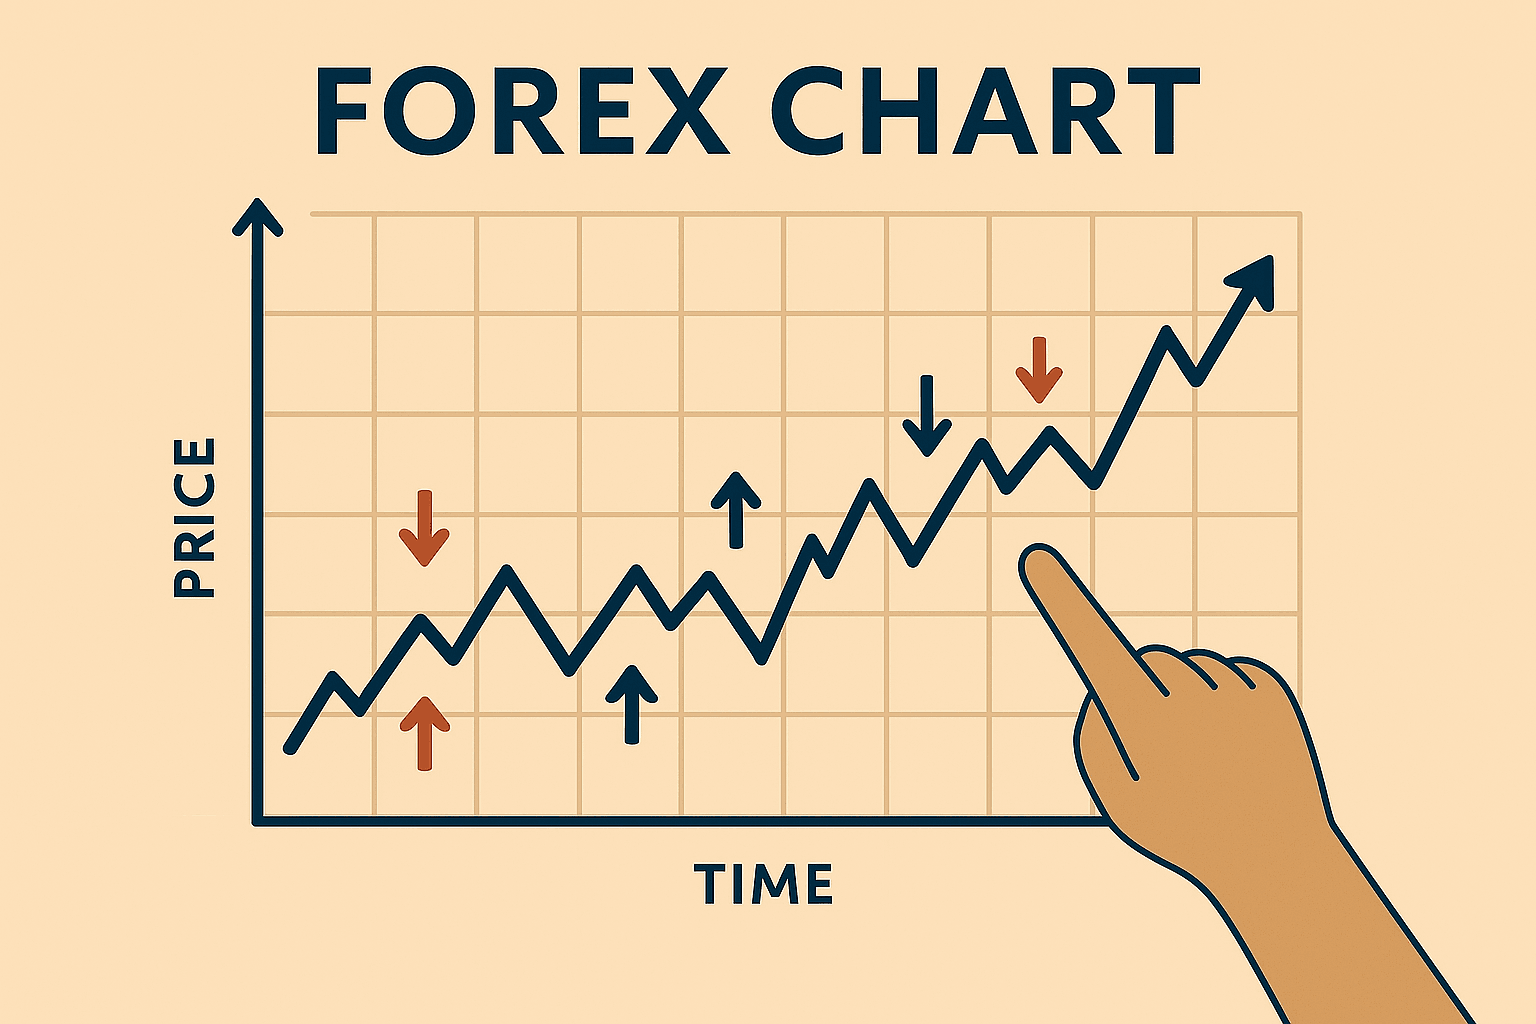
1. Line Chart
- Plots a simple line from one closing price to the next.
- Best for seeing overall direction (trend).
- Clean and easy to understand perfect for beginners.
2. Bar Chart
- Displays open, high, low, and close (OHLC) for each time period.
- Gives more detail than a line chart but can look complex at first.
3. Candlestick Chart
- The most popular chart type.
- Each “candle” shows open, high, low, and close plus color coding (green for bullish, red for bearish).
- Offers visual clarity and patterns (e.g., doji, engulfing candles, etc.)
📘 Want to dig deeper into chart types? Check out Investopedia’s chart basics.
Understanding Timeframes

Forex charts can be viewed in different timeframes, from 1-minute to monthly.
- Short timeframes (1M, 5M, 15M): Ideal for scalping and intraday trading.
- Medium timeframes (1H, 4H): Used by swing traders and short-term setups.
- Long timeframes (Daily, Weekly): Best for identifying trends and long-term trades.
A solid approach is to analyze on higher timeframes, then enter trades on lower timeframes known as multi-timeframe analysis.
How to Read Candlestick Patterns
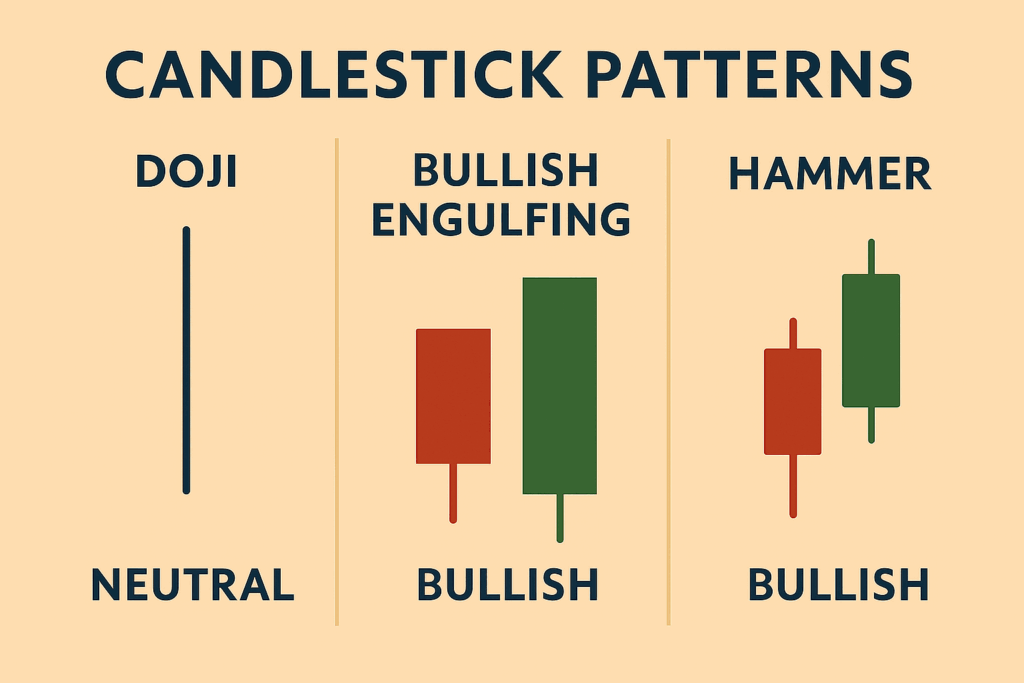
Candlesticks form patterns that offer insights into price behavior. Some key examples:
- Doji: Indicates indecision possible reversal.
- Engulfing Candle: Strong sign of trend reversal.
- Hammer / Hanging Man: Signals possible bounce or drop depending on context.
Understanding these patterns helps traders anticipate market moves especially near key support and resistance levels.
What Are Support and Resistance?
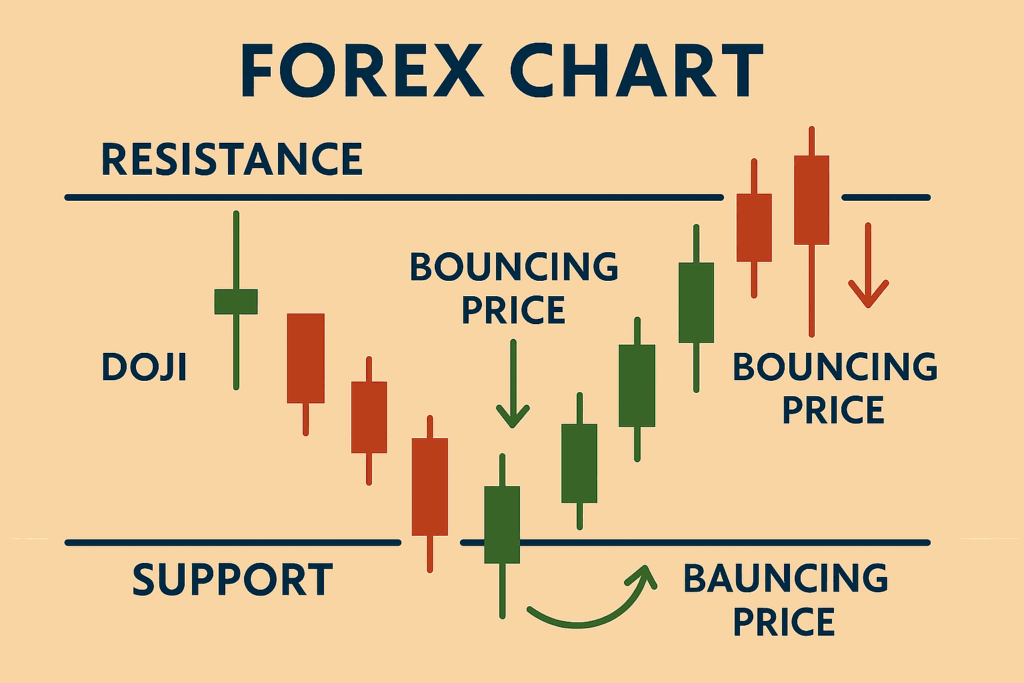
- Support: A price level where buying interest may be strong enough to prevent further decline.
- Resistance: A price level where selling pressure may stop an upward move.
On charts, these levels appear as horizontal lines where price repeatedly bounces off or gets rejected.
Identifying support/resistance helps you decide where to enter, exit, or place stop-loss orders.
Using Indicators with Charts
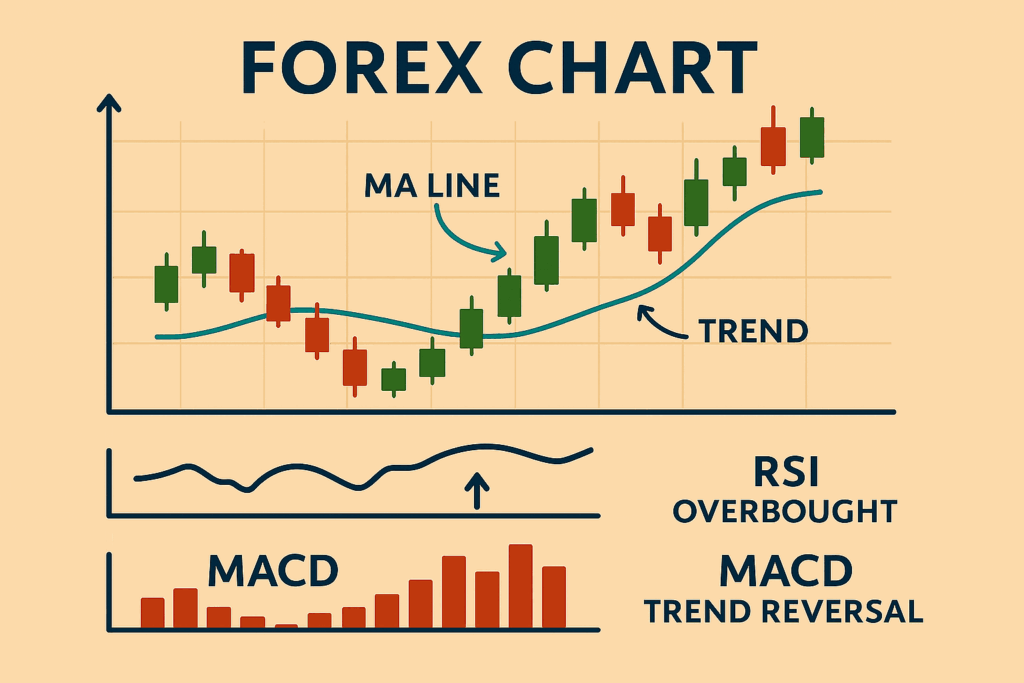
Many traders combine charts with technical indicators to improve accuracy. Common indicators include:
- Moving Averages (MA) – Show trend direction and potential entry points.
- Relative Strength Index (RSI) – Measures overbought/oversold conditions.
- MACD (Moving Average Convergence Divergence) – Helps identify trend shifts.
📊 Tip: Don’t overload your chart. Start with one or two indicators and learn how they behave with price action.
Real Example: Reading a EUR/USD Chart
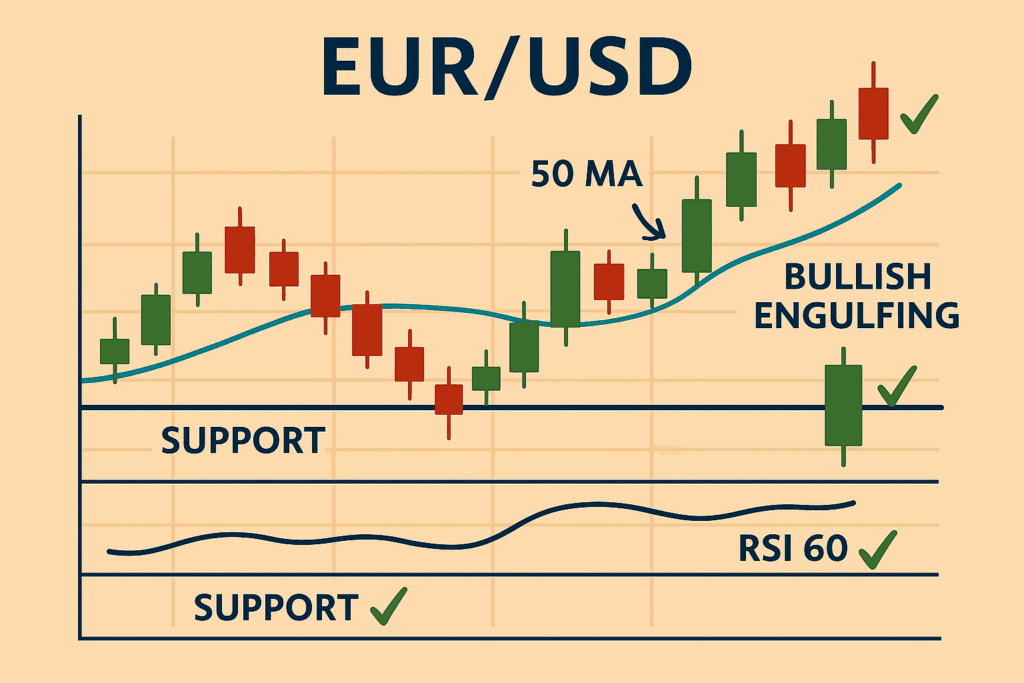
Imagine you’re looking at a EUR/USD candlestick chart on a 1-hour timeframe:
- Price is moving above a rising 50-period MA → uptrend.
- RSI is around 60 → bullish but not overbought.
- You see a bullish engulfing candle bouncing off support.
- You spot a bullish engulfing candle bouncing off support this can signal a good entry, especially when supported by FXProfitBuilder’s professional daily signals.
This setup may suggest a good buying opportunity if your risk-reward ratio aligns.
Final Thoughts

Reading forex charts is like learning a new language at first it’s unfamiliar, but with practice, it becomes second nature. As a beginner, focus on understanding candlestick basics, trend direction, support/resistance, and a few reliable indicators.
Don’t rush into trades just because a chart “looks good.” Combine your chart analysis with a solid trading plan, risk management, and market awareness.